NYC AMI Chart 2026: Complete Income Limits by Percentage (30%-165%)
Introduction
Understanding the NYC Area Median Income (AMI) chart is essential for anyone applying to affordable housing lotteries. AMI determines whether you qualify for income-restricted apartments, what rent you'll pay, and which lotteries you're eligible to enter.
This guide provides the complete 2026 NYC AMI chart with income limits from 30% to 165% AMI for household sizes 1–8 people, explains how HUD calculates these figures, and shows you exactly how to use the chart to find your eligibility.
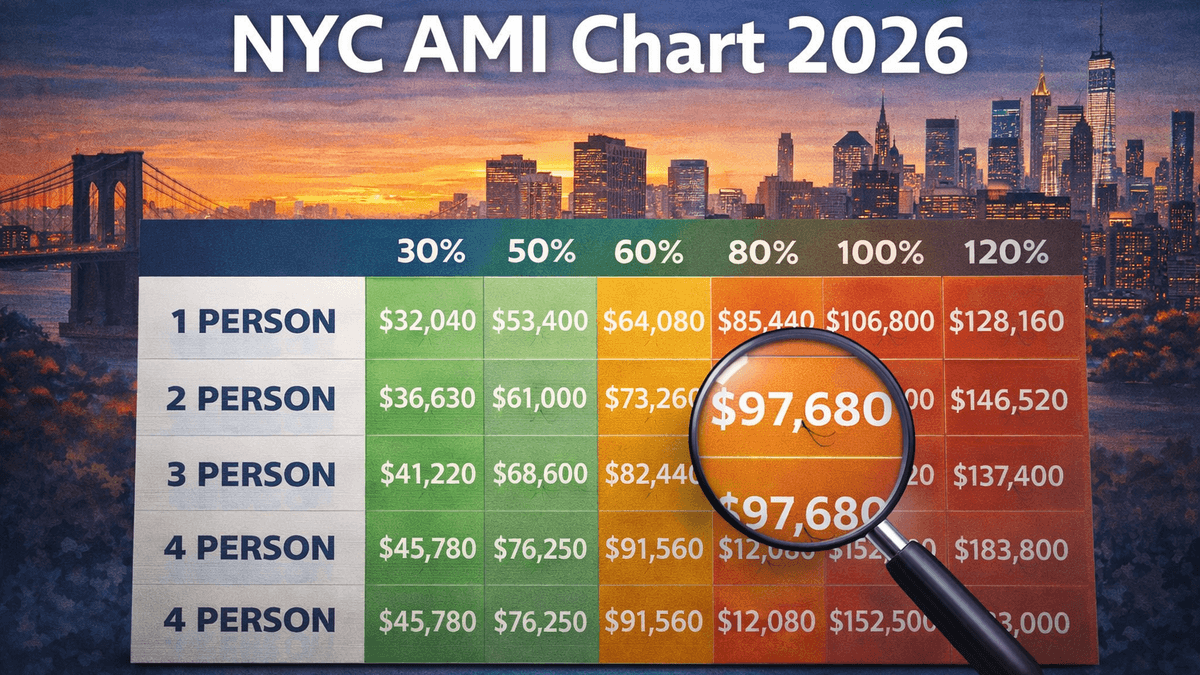
Complete 2026 NYC AMI income chart with limits for all household sizes from 30% to 165% AMI for affordable housing eligibility.
What Is the NYC AMI Chart?
The NYC AMI Chart is an official income table published annually by the U.S. Department of Housing and Urban Development (HUD). It lists maximum income limits for households of different sizes across various AMI percentage bands.
Key Purpose: The chart determines eligibility for:
- NYC Housing Connect affordable housing lotteries
- Section 8 housing vouchers
- Mitchell-Lama housing programs
- NYCHA public housing (in some cases)
- Low-Income Housing Tax Credit (LIHTC) developments
Update Frequency: HUD updates the AMI chart every April based on median household income data for the New York-Newark metropolitan area.
How AMI Is Calculated
Step 1: HUD determines the median income for the NY-Newark metro area using census data and income surveys.
Step 2: This figure becomes "100% AMI" (the baseline for all calculations).
Step 3: Income limits for smaller households are adjusted downward (80% of the median for 1 person, 90% for 2 people).
Step 4: Income limits for larger households are adjusted upward (108% for 5 people, 116% for 6 people).
Step 5: Percentage bands (30%, 40%, 50%, etc.) are calculated as fractions of the adjusted figures.
For 2026: The baseline AMI for a family of three in the NYC metro area is approximately $121,500.
Complete 2026 NYC AMI Chart by Household Size
30% AMI (Extremely Low Income)
| Household Size | Maximum Annual Income |
|---|---|
| 1 person | $28,350 |
| 2 people | $32,400 |
| 3 people | $36,450 |
| 4 people | $40,450 |
| 5 people | $43,700 |
| 6 people | $46,900 |
| 7 people | $50,150 |
| 8 people | $53,350 |
Typical Monthly Rent: $700–$1,100
Who Qualifies: Households receiving public assistance, SSI, very low-wage workers
Unit Availability: Limited. Only 5–10% of lotteries target 30% AMI.
40% AMI (Very Low Income)
| Household Size | Maximum Annual Income |
|---|---|
| 1 person | $37,800 |
| 2 people | $43,200 |
| 3 people | $48,600 |
| 4 people | $53,950 |
| 5 people | $58,250 |
| 6 people | $62,550 |
| 7 people | $66,850 |
| 8 people | $71,100 |
Typical Monthly Rent: $950–$1,450
Who Qualifies: Low-wage service workers, part-time employees, seniors on fixed incomes
Unit Availability: Moderate. Approximately 15–20% of lotteries target 40% AMI.
50% AMI (Low Income)
| Household Size | Maximum Annual Income |
|---|---|
| 1 person | $47,250 |
| 2 people | $54,000 |
| 3 people | $60,750 |
| 4 people | $67,450 |
| 5 people | $72,850 |
| 6 people | $78,200 |
| 7 people | $83,550 |
| 8 people | $88,900 |
Typical Monthly Rent: $1,180–$1,750
Who Qualifies: Entry-level workers, retail/food service employees, home health aides
Unit Availability: High. 20–25% of lotteries target 50% AMI.
60% AMI (Low Income – Most Common)
| Household Size | Maximum Annual Income |
|---|---|
| 1 person | $56,700 |
| 2 people | $64,800 |
| 3 people | $72,900 |
| 4 people | $80,900 |
| 5 people | $87,400 |
| 6 people | $93,850 |
| 7 people | $100,300 |
| 8 people | $106,700 |
Typical Monthly Rent: $1,420–$2,100
Who Qualifies: Public sector workers, administrative assistants, early-career professionals
Unit Availability: Very High. 40–50% of lotteries target 60% AMI.
70% AMI (Moderate Income)
| Household Size | Maximum Annual Income |
|---|---|
| 1 person | $66,150 |
| 2 people | $75,600 |
| 3 people | $85,050 |
| 4 people | $94,450 |
| 5 people | $102,000 |
| 6 people | $109,550 |
| 7 people | $117,050 |
| 8 people | $124,550 |
Typical Monthly Rent: $1,650–$2,450
Who Qualifies: Teachers, nurses, city employees, dual-income households
Unit Availability: Moderate. 10–15% of lotteries target 70% AMI.
80% AMI (Moderate Income)
| Household Size | Maximum Annual Income |
|---|---|
| 1 person | $75,600 |
| 2 people | $86,400 |
| 3 people | $97,200 |
| 4 people | $107,900 |
| 5 people | $116,550 |
| 6 people | $125,150 |
| 7 people | $133,750 |
| 8 people | $142,350 |
Typical Monthly Rent: $1,890–$2,750
Who Qualifies: Mid-career professionals, skilled tradespeople, middle-income families
Unit Availability: Moderate. 15–20% of lotteries target 80% AMI.
100% AMI (Median Income)
| Household Size | Maximum Annual Income |
|---|---|
| 1 person | $94,500 |
| 2 people | $108,000 |
| 3 people | $121,500 |
| 4 people | $134,850 |
| 5 people | $145,650 |
| 6 people | $156,450 |
| 7 people | $167,200 |
| 8 people | $177,950 |
Typical Monthly Rent: $2,360–$3,450
Who Qualifies: Established professionals, dual-income households, managers
Unit Availability: Low. Only 5–10% of lotteries target 100% AMI.
120% AMI (Middle Income)
| Household Size | Maximum Annual Income |
|---|---|
| 1 person | $113,400 |
| 2 people | $129,600 |
| 3 people | $145,800 |
| 4 people | $161,820 |
| 5 people | $174,780 |
| 6 people | $187,740 |
| 7 people | $200,640 |
| 8 people | $213,540 |
Typical Monthly Rent: $2,830–$4,150
Who Qualifies: Higher-earning professionals, senior-level employees
Unit Availability: Very Low. Only 2–5% of lotteries target 120% AMI.
130% AMI (Middle-Upper Income)
| Household Size | Maximum Annual Income |
|---|---|
| 1 person | $122,850 |
| 2 people | $140,400 |
| 3 people | $157,950 |
| 4 people | $175,305 |
| 5 people | $189,345 |
| 6 people | $203,385 |
| 7 people | $217,360 |
| 8 people | $231,335 |
Typical Monthly Rent: $3,070–$4,500
Who Qualifies: High-earning professionals who still need affordable options compared to market-rate
Unit Availability: Very Low. Less than 2% of lotteries target 130% AMI.
165% AMI (Upper-Middle Income)
| Household Size | Maximum Annual Income |
|---|---|
| 1 person | $155,925 |
| 2 people | $178,200 |
| 3 people | $200,475 |
| 4 people | $222,503 |
| 5 people | $240,323 |
| 6 people | $258,143 |
| 7 people | $275,890 |
| 8 people | $293,638 |
Typical Monthly Rent: $3,900–$5,700
Who Qualifies: High-income professionals in ultra-competitive markets (rare)
Unit Availability: Extremely Rare. Less than 1% of lotteries target 165% AMI.
How to Use the NYC AMI Chart
Step 1: Calculate Your Gross Household Income
Add up all income for all adults in your household:
- Wages and salaries (before taxes)
- Self-employment income
- Social Security benefits
- Unemployment benefits
- Child support and alimony
- Pension and retirement income
- Investment income (interest, dividends, capital gains)
Example:
- You earn $50,000/year
- Your partner earns $35,000/year
- Total Household Income: $85,000/year
Step 2: Determine Your Household Size
Count everyone who will live in the unit:
- Adults (18+)
- Children (under 18)
- Dependents (elderly parents, relatives)
Example: You, your partner, and one child = 3 people
Step 3: Find Your AMI Percentage
Look at the chart and find where your income falls:
Using the Example Above:
- Household income: $85,000
- Household size: 3 people
Chart Results:
- 60% AMI for 3 people: $72,900 (you're above this)
- 70% AMI for 3 people: $85,050 (you're just under this)
- 80% AMI for 3 people: $97,200 (you're below this)
Conclusion: You qualify for 70% AMI or higher lotteries, but not 60% AMI or below.
Step 4: Filter Housing Connect Listings
Go to NYC Housing Connect and filter:
- Income Band: 70%, 80%, 100% AMI
- Borough: Your preference
- Bedroom Count: 2BR (for 3 people)
Result: You'll only see lotteries you're eligible for, saving time and avoiding rejected applications.
AMI Chart by Income Level: Who Qualifies?
Extremely Low Income (30%–40% AMI)
Typical Households:
- Individuals on SSI or disability
- Seniors on fixed Social Security income
- Part-time minimum wage workers
- Households receiving public assistance
Housing Challenge: Very limited lottery options. High demand for these units.
Low Income (50%–60% AMI)
Typical Households:
- Retail and food service workers
- Home health aides
- Entry-level office workers
- Single parents with part-time work
Housing Challenge: Most competitive AMI band (40–50% of all lotteries target this group).
Moderate Income (70%–80% AMI)
Typical Households:
- Teachers and public school employees
- Nurses and healthcare workers
- City government employees
- Dual-income families with entry-level jobs
Housing Challenge: Moderate competition. More options than lower AMI bands.
Middle Income (100%–130% AMI)
Typical Households:
- Mid-career professionals
- Corporate managers
- Established small business owners
- Dual-income households with stable careers
Housing Challenge: Limited lottery availability. Market-rate might be a better option for this group.
Common AMI Chart Mistakes
Mistake 1: Using Net Income Instead of Gross
Problem: Subtracting taxes and deductions before calculating AMI eligibility.
Correct Method: Use gross income (before taxes).
Example:
- Gross income: $70,000
- After-tax income: $52,000
- Use: $70,000 (not $52,000)
Mistake 2: Not Including All Household Income
Problem: Forgetting to include a partner's income, side gig earnings, or investment income.
Result: Incorrect AMI calculation, leading to disqualification during document review.
Fix: Add up all income from all sources for all adults.
Mistake 3: Applying to the Wrong AMI Band
Problem: Your household earns $90,000, but you apply to a 60% AMI lottery (max $80,900 for your household size).
Result: Automatic rejection.
Fix: Use the NYC AMI Calculator to verify eligibility before applying.
Mistake 4: Rounding Income Figures
Problem: Your income is $81,200, and you round down to $80,900 to qualify for 60% AMI.
Result: Disqualification and potential fraud investigation.
Fix: Report your exact, full gross income. Even $1 over the limit disqualifies you.
Mistake 5: Assuming AMI Never Changes
Problem: Using 2026 Income Limits to apply for 2026 lotteries.
Result: Applying to lotteries you don't qualify for.
Fix: Always check the current year's AMI chart on NYC Housing Connect or HUD's website.
AMI vs. FPL: What's the Difference?
AMI (Area Median Income)
What It Is: The midpoint household income for a specific metro area (NYC-Newark).
Set By: U.S. Department of Housing and Urban Development (HUD)
Used For: NYC Housing Connect lotteries, LIHTC developments, inclusionary zoning programs
Updates: Annually (every April)
FPL (Federal Poverty Level)
What It Is: A national poverty threshold set by the U.S. government.
Set By: U.S. Department of Health and Human Services (HHS)
Used For: Medicaid, SNAP (food stamps), CHIP, ACA subsidies
Updates: Annually (every January)
Why AMI Matters for NYC Housing
NYC affordable housing programs use AMI, not FPL, because:
- Regional Adjustment: AMI reflects NYC's high cost of living, while FPL is a national figure
- Higher Income Thresholds: 60% AMI in NYC is ~$65,000 for 2 people, while FPL is ~$20,000
- Relevant Eligibility: NYC housing costs require income limits tied to local median incomes
Bottom Line: If you're applying for NYC affordable housing, focus on AMI—not FPL.
Frequently Asked Questions
What is the 2026 NYC AMI for a family of four?
For a family of four at 60% AMI (the most common band), the maximum income is $80,900 in 2026. At 100% AMI, it's $134,850.
How do I find my AMI percentage in NYC?
Calculate your household's gross annual income, divide it by the maximum income for your household size at a given AMI percentage, and see which band you fall into. Use the NYC AMI Calculator for instant results.
What is 80% AMI in NYC for 2 people?
For a 2-person household at 80% AMI in 2026, the maximum income is $86,400.
Does AMI include all household income?
Yes. AMI calculations include all income from all adults in the household: wages, benefits, self-employment, investments, alimony, child support, and more.
Is NYC AMI the same for all five boroughs?
Yes. NYC uses a single AMI figure across the Bronx, Brooklyn, Manhattan, Queens, and Staten Island. However, rents vary by borough and neighborhood.
What AMI level qualifies for NYC housing lottery?
Most NYC housing lotteries target 50%–80% AMI. Some developments offer 30% AMI (extremely low income) or 100%–130% AMI (middle income) units.
How often does NYC AMI change?
HUD updates NYC AMI limits every April based on the previous year's income data. Expect changes of 2–5% annually.
What happens if my income is $1 over the AMI limit?
You do not qualify. Even being $1 over the maximum income for your household size results in automatic disqualification.
Conclusion
The 2026 NYC AMI chart is your roadmap to understanding which affordable housing lotteries you qualify for. By knowing your exact AMI percentage, you can focus your applications on eligible lotteries, avoid wasting time on ineligible ones, and increase your chances of securing an affordable apartment.
Use the chart regularly, update your income calculations when your earnings change, and consider using the NYC AMI Calculator for instant, accurate eligibility checks before applying to any lottery.
Internal Links:
- NYC AMI Calculator
- NYC Income Limits Guide
- Sign Up for NYC Housing Lottery Alerts
- Complete NYC Housing Lottery Guide
- NYC Housing Lottery FAQ
External Resources: