Editorial insights

NYC AMI Chart 2026: Complete Income Limits by Percentage (30%-165%)

Complete NYC AMI chart for 2026 with income limits for every percentage (30%-165%) and household size. Official HUD data for Housing Connect lottery eligibility.

Updated January 2, 2026

NYC AMI Chart 2026: Complete Income Limits by Percentage (30%-165%) - Comprehensive guide to NYC Housing Lottery with visual infographic showing key information, timelines, and strategies

Introduction

Understanding the NYC Area Median Income (AMI) chart is essential for anyone applying to affordable housing lotteries.

AMI determines whether you qualify for income-restricted apartments, what rent you'll pay, and which lotteries you're eligible to enter.

This guide provides the complete 2026 NYC AMI chart with income limits from 30% to 165% AMI for household sizes 1–8 people, explains how HUD calculates these figures, and shows you exactly how to use the chart to find your eligibility.

What Is the NYC AMI Chart?

The NYC AMI Chart is an official income table published annually by HUD. It lists maximum income limits for households of different sizes across various AMI percentage bands.

Key Purpose: The chart determines eligibility for NYC Housing Connect affordable housing lotteries, Section 8 housing vouchers, Mitchell-Lama housing programs, NYCHA public housing (in some cases), and Low-Income Housing Tax Credit (LIHTC) developments.

Update Frequency: HUD updates the AMI chart every April based on median household income data for the New York-Newark metropolitan area.

How AMI Is Calculated: HUD determines the median income for the NY-Newark metro area using census data and income surveys. This figure becomes "100% AMI" (the baseline for all calculations). Income limits for smaller households are adjusted downward (80% of the median for 1 person, 90% for 2 people), and larger households are adjusted upward (108% for 5 people, 116% for 6 people). Percentage bands (30%, 40%, 50%, etc.) are calculated as fractions of the adjusted figures. For 2026: The baseline AMI for a family of three in the NYC metro area is approximately $121,500.

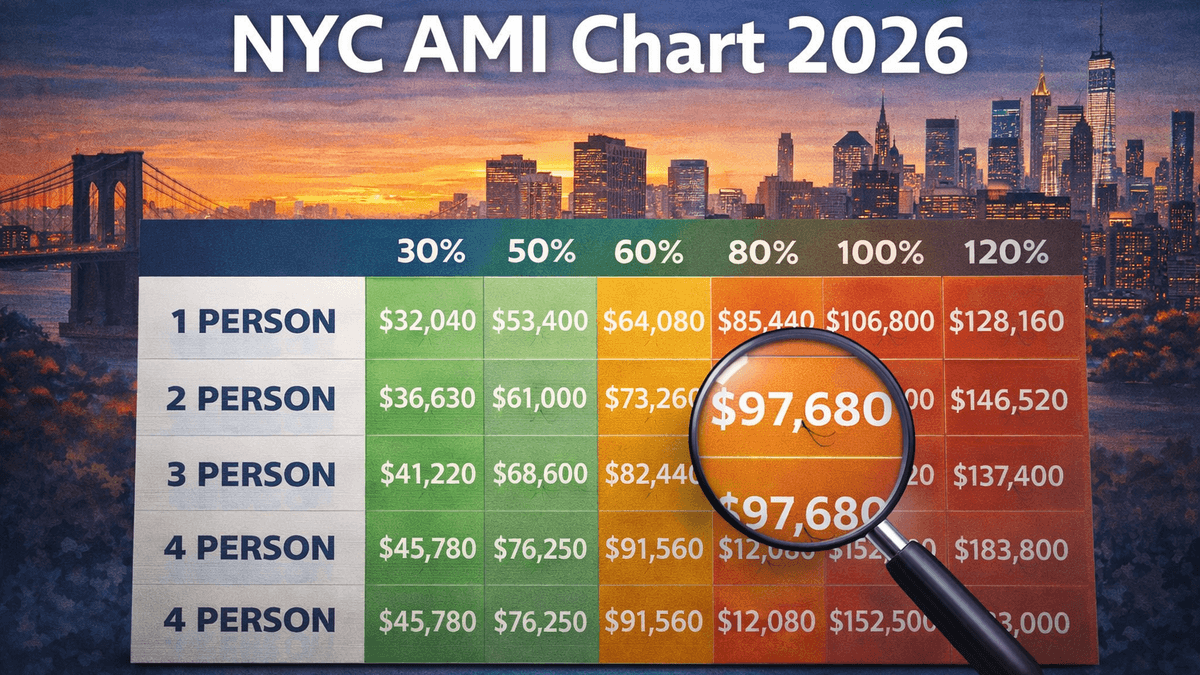
Complete 2026 NYC AMI Chart by Household Size

30% AMI (Extremely Low Income) - Household Size: 1 person: $28,350, 2 people: $32,400, 3 people: $36,450, 4 people: $40,450, 5 people: $43,700, 6 people: $46,900, 7 people: $50,150, 8 people: $53,350. Typical Monthly Rent: $700–$1,100. Who Qualifies: Households receiving public assistance, SSI, very low-wage workers. Unit Availability: Limited (only 5–10% of lotteries target 30% AMI).

40% AMI (Very Low Income) - Household Size: 1 person: $37,800, 2 people: $43,200, 3 people: $48,600, 4 people: $53,950, 5 people: $58,250, 6 people: $62,550, 7 people: $66,850, 8 people: $71,100. Typical Monthly Rent: $950–$1,450. Who Qualifies: Low-wage service workers, part-time employees, seniors on fixed incomes. Unit Availability: Moderate (approximately 15–20% of lotteries).

50% AMI (Low Income) - Household Size: 1 person: $47,250, 2 people: $54,000, 3 people: $60,750, 4 people: $67,450, 5 people: $72,850, 6 people: $78,200, 7 people: $83,550, 8 people: $88,900. Typical Monthly Rent: $1,180–$1,750. Who Qualifies: Entry-level workers, retail/food service employees, home health aides. Unit Availability: High (20–25% of lotteries).

60% AMI (Low Income – Most Common) - Household Size: 1 person: $56,700, 2 people: $64,800, 3 people: $72,900, 4 people: $80,900, 5 people: $87,400, 6 people: $93,850, 7 people: $100,300, 8 people: $106,700. Typical Monthly Rent: $1,420–$2,100. Who Qualifies: Public sector workers, administrative assistants, early-career professionals. Unit Availability: Very High (40–50% of lotteries target 60% AMI).

70% AMI (Moderate Income) - Household Size: 1 person: $66,150, 2 people: $75,600, 3 people: $85,050, 4 people: $94,450, 5 people: $102,000, 6 people: $109,550, 7 people: $117,050, 8 people: $124,550. Typical Monthly Rent: $1,650–$2,450.

80% AMI (Moderate Income) - Household Size: 1 person: $75,600, 2 people: $86,400, 3 people: $97,200, 4 people: $107,900, 5 people: $116,550, 6 people: $125,150, 7 people: $133,750, 8 people: $142,350. Typical Monthly Rent: $1,890–$2,800. Who Qualifies: Teachers, nurses, skilled tradespeople, dual-income working families. Unit Availability: Moderate (20–30% of lotteries).

100% AMI (Moderate-Middle Income) - Household Size: 1 person: $94,500, 2 people: $108,000, 3 people: $121,500, 4 people: $134,850, 5 people: $145,700, 6 people: $156,450, 7 people: $167,200, 8 people: $177,950. Typical Monthly Rent: $2,360–$3,500. Who Qualifies: Mid-level managers, healthcare professionals, dual-income professional couples. Unit Availability: Low (10–15% of lotteries).

120% AMI (Middle Income) - Household Size: 1 person: $113,400, 2 people: $129,600, 3 people: $145,800, 4 people: $161,850, 5 people: $174,800, 6 people: $187,700, 7 people: $200,600, 8 people: $213,500. Typical Monthly Rent: $2,835–$4,200.

130% AMI (Middle-Upper Income) - Household Size: 1 person: $122,850, 2 people: $140,400, 3 people: $157,950, 4 people: $175,305, 5 people: $189,410, 6 people: $203,385, 7 people: $217,360, 8 people: $231,335. Typical Monthly Rent: $3,070–$4,500. Unit Availability: Very Low (5–10% of lotteries).

165% AMI (Upper-Middle Income) - Household Size: 1 person: $155,925, 2 people: $178,200, 3 people: $200,475, 4 people: $222,503, 5 people: $240,358, 6 people: $258,028, 7 people: $275,698, 8 people: $293,368. Typical Monthly Rent: $3,900–$5,600. Unit Availability: Rare (less than 5% of lotteries).

How to Use the NYC AMI Chart

Step 1: Calculate Your Gross Annual Income - Add up all income sources for every adult in your household (wages, salaries, self-employment, Social Security, unemployment, child support, alimony, pension, investment income). Use gross income (before taxes and deductions).

Step 2: Determine Your Household Size - Count everyone who will live in the unit full-time (adults, children, dependents).

Step 3: Find Your AMI Percentage - Locate your household size in the chart and compare your gross annual income to the maximum limits for each AMI band. If your income is $72,000 for a 3-person household, you exceed 60% AMI ($72,900) but fall within 80% AMI ($97,200), so you qualify for 70%+ AMI lotteries.

Step 4: Filter NYC Housing Connect by Your AMI - When browsing lotteries, use the income band filter to show only lotteries you're eligible for. This saves time and prevents wasted applications.

Common AMI Chart Questions

Does my income include taxes? No. AMI is calculated using gross income before taxes, retirement contributions, and other deductions.

What if my income changed recently? Use your current income, not last year's tax return. If your income increased or decreased significantly, report the current amount and be prepared to document it.

What happens if I'm $1 over the AMI limit? You're disqualified. Even exceeding the maximum income by $1 results in automatic rejection.

Can I apply to lotteries below my income level? No. If your income exceeds the maximum limit for a specific AMI band, you cannot apply to lotteries targeting that band. You can only apply to bands at or above your income level.

Do AMI limits differ by borough? No. NYC uses a single AMI chart for all five boroughs. However, actual rent amounts vary by neighborhood based on construction costs and location.

How AMI Affects Rent

The 30% Rule: NYC affordable housing programs set rent at 30% of gross household income. Example: If your household earns $60,000/year ($5,000/month), your rent would be approximately $1,500/month (30% of $5,000).

Minimum Income Requirements: Even if you fall within an AMI band's maximum limit, you must earn enough to afford the rent. Most lotteries set a minimum income threshold (typically 2.5x to 3x monthly rent) to ensure applicants can pay rent sustainably.

Rent Varies by Borough: Although AMI limits are the same citywide, actual rents differ: Bronx (lowest rents), Queens (moderate rents), Brooklyn (moderate to high rents), Staten Island (moderate rents), Manhattan (highest rents).

Conclusion

The 2026 NYC AMI chart is your roadmap to finding affordable housing opportunities you qualify for.

By calculating your household income, determining your household size, and identifying your AMI percentage, you can target the right lotteries and avoid wasted applications.

Use the NYC AMI Calculator at nychousinglottery.com/ami-calculator for instant results, and set up alerts to be notified when new lotteries matching your AMI band open.

Related resources

Keep researching with borough guides, AMI explainers, and our Reddit-inspired FAQ.

Ready to act on these insights?

Save your preferences and we will send borough, AMI, and bedroom-matched alerts plus Reddit-tested checklists.

Get Email Alerts